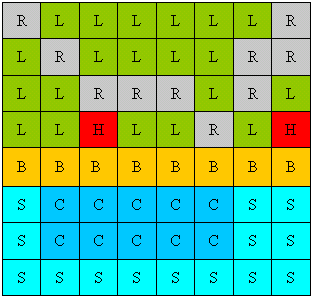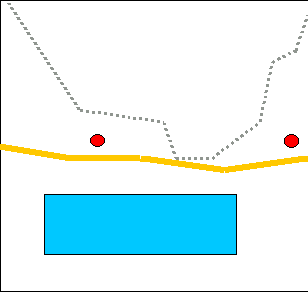

C = Conservation area, S = Sea
|
Raster Raster format data represents reality as a grid, rather like a chessboard. Each square (or raster cell) covers a discrete geographic area and has one attribute associated with it. The raster cell is the smallest geographic unit that can be represented within a raster GIS, so it is known as the ‘minimum mapping unit’. The smaller the minimum mapping unit, the higher the resolution of the dataset and the greater the amount of detail that can be represented. Visually, shapes or geographic patterns are represented as by combinations of raster cells. This means that complex shapes (such as a administrative boundary) or linear features (such as coastlines) can look quite blocky and unnatural. Most remotely sensed data is collected in raster format, which means the data does not need to be converted prior to use in a raster GIS. |
Vector Vector format data visually represents reality through combinations of points and lines. These can also be joined to form polygons. This means that is it much easier to represent complex shapes or linear features in vector format, as the required detail can be inserted. Most map output from GIS is produced in vector format. Remotely sensed data will require conversion before it can be used in a vector GIS. |
The following two diagrams show raster and vector representations of the same coastal area. Note how the raster representation has a block-like appearance, whilst the vector representation is made up of points, lines and polygons.
| Raster representation | Vector representation |
 |
 |
| R
= Road, L = Land, H = House, B = Beach, C = Conservation area, S = Sea |